pyIMD example IPython/Jupyter notebook
[11]:
from pyIMD.imd import InertialMassDetermination
[12]:
imd = InertialMassDetermination()
2019-03-24 22:05:11 - pyIMD.imd - Object constructed successfully
[13]:
file_path1 = "../data/pll/20170712_RSN_3_B"
file_path2 = "../data/pll/20170712_RSN_3_A"
file_path3 = "../data/pll/20170712_RSN_3_A_long_term.tdms"
[14]:
imd.create_pyimd_project(file_path1, file_path2, file_path3, '\t', 23, 'PLL', figure_height=40,
                         figure_unit='cm',initial_parameter_guess=[70.0, 2, 0.0, 0.0],
                         upper_parameter_bounds=[100.0, 5, 3.0, 3.0], spring_constant=1.05,
                         cell_position=3.23, cantilever_length=59.84, figure_format='png',
                         correct_for_frequency_offset=True, frequency_offset_n_measurements_used=15)
[15]:
imd.run_inertial_mass_determination()
2019-03-24 22:05:12 - pyIMD.imd - Start reading all files
2019-03-24 22:06:32 - pyIMD.imd - Done reading all files
2019-03-24 22:06:32 - pyIMD.imd - Done converting units
2019-03-24 22:06:33 - pyIMD.imd - Done with pre start no cell resonance frequency calculation
2019-03-24 22:06:34 - pyIMD.imd - Done with pre start with cell resonance frequency calculation
2019-03-24 22:06:36 - pyIMD.imd - Done with pre start frequency shift figure generation
2019-03-24 22:06:36 - pyIMD.imd - Offset calculation result: -0.10173519457150339
100%|██████████| 692625/692625 [00:21<00:00, 32255.79it/s]
2019-03-24 22:06:57 - pyIMD.imd - Start writing figure to disk
2019-03-24 22:08:50 - pyIMD.imd - Done writing figure to disk
2019-03-24 22:08:50 - pyIMD.imd - Start writing data to disk
2019-03-24 22:08:54 - pyIMD.imd - Done writing data to disk
2019-03-24 22:08:54 - pyIMD.imd - Done with all calculations
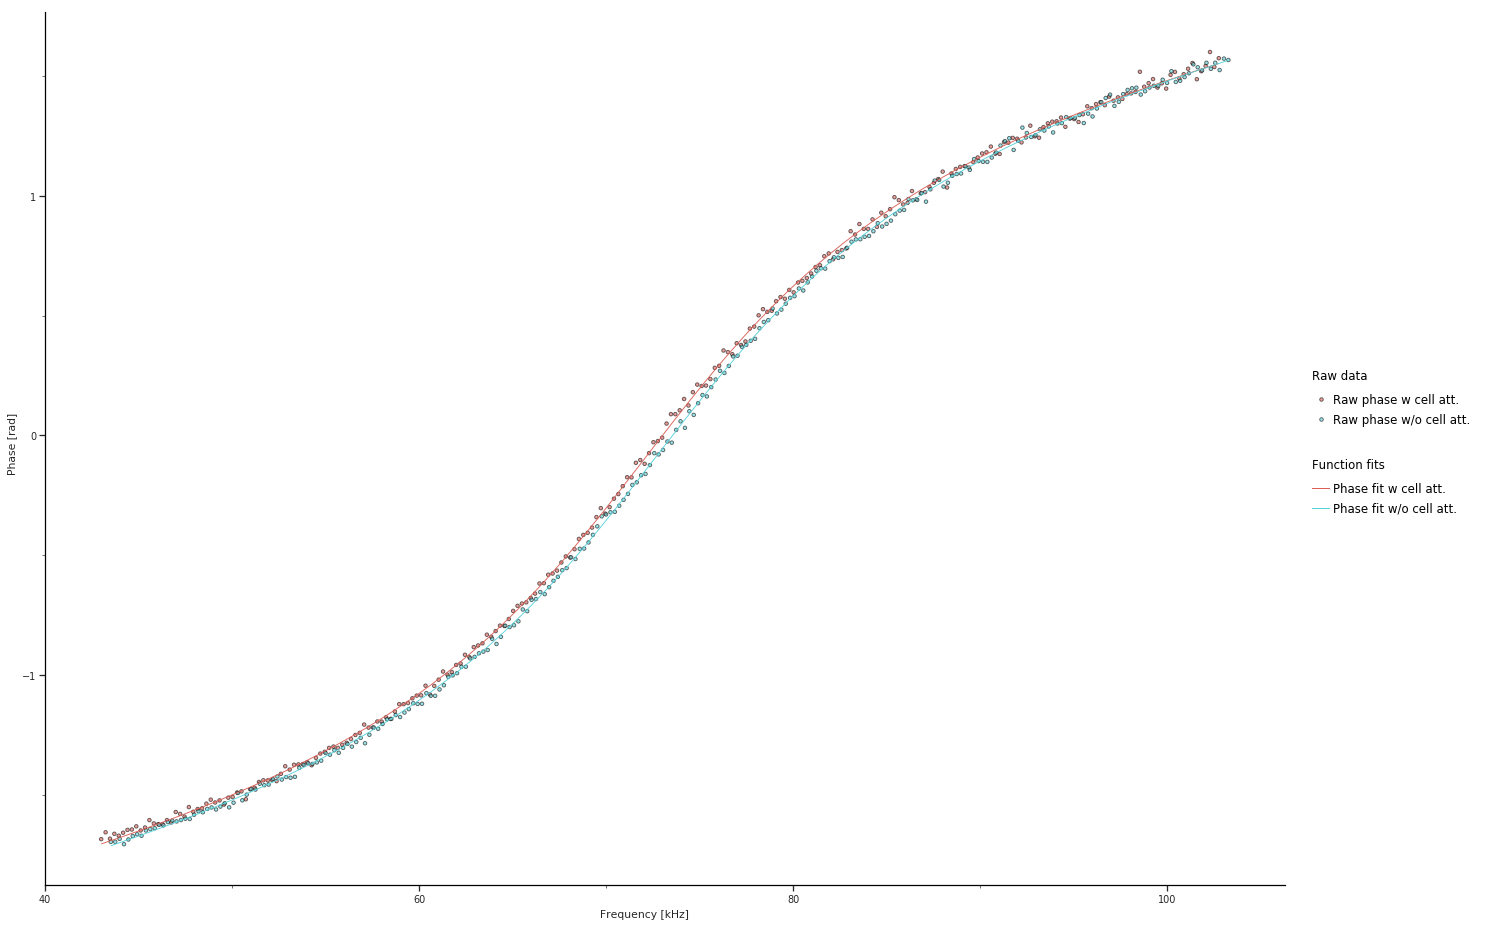
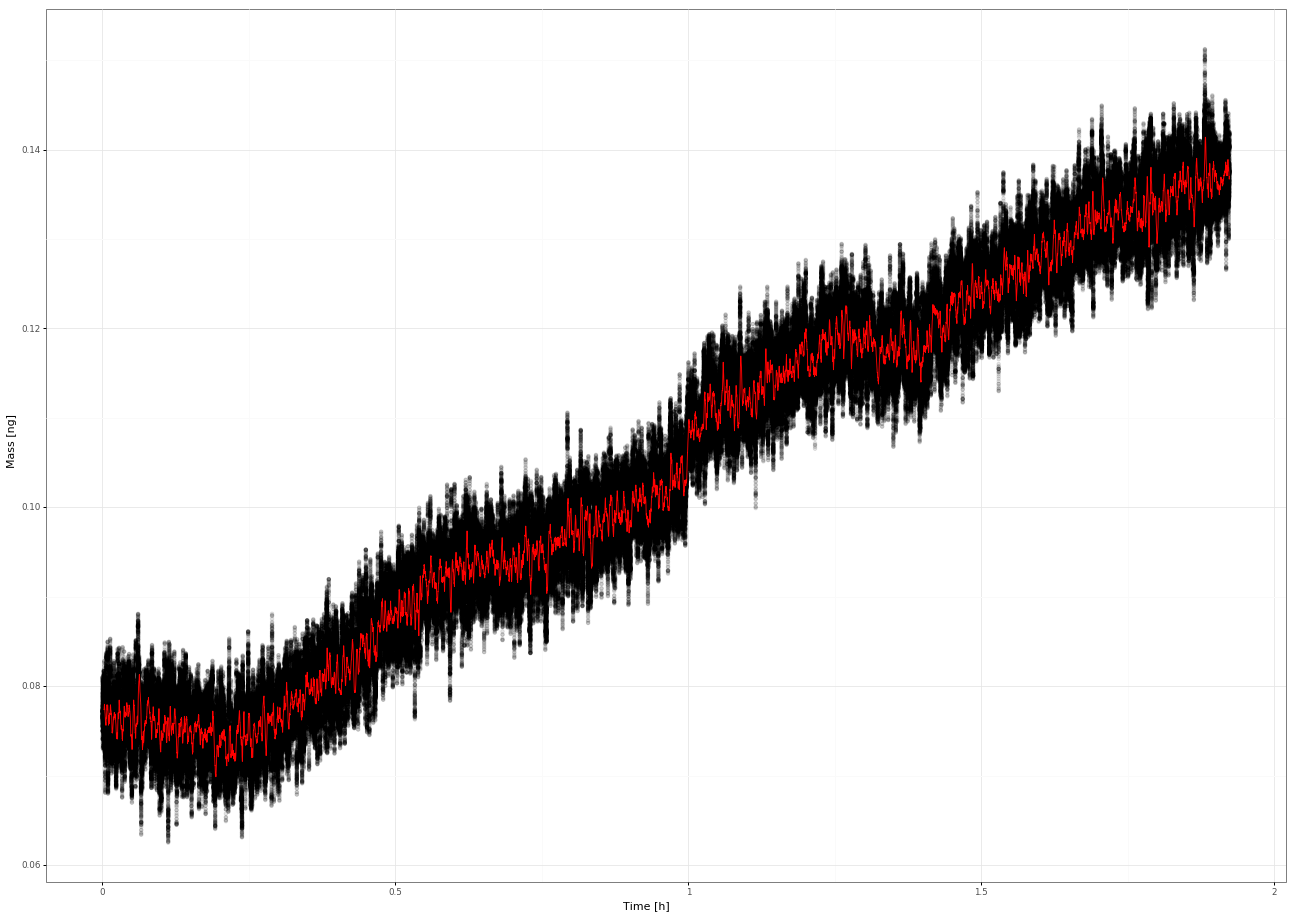
The run_intertial_mass_determination() method generates automatically figures of the curve fitting for the per pre experiment data with and without a cell attached to the cantilever. A combined figure illustrating the shift in the phase response and the function fits and the resulting calculated cell mass of the long term measurement data.
Show resulting plots
- Shift in the phase response with and without cell attached to the cantilever and the corresponding function fit
- Final result of the mass calculation for the long term data set
[ ]: